Are Real Estate Prices Too High in Canada? Assessing Affordability in the Great White North
It’s one of the most common questions our investors and clients ask us: Are Canadian real estate prices too high? We put together a report to give an in-depth analysis with data and insights from our management team.
Key Points
- How do Canada’s price to income ratios compare to other markets?
- How does Canada’s population growth compare to other markets?
- How does employment quality among Canada’s foreign-born population compare to other markets?
- How does Canada’s household disposable income compare to other markets?
- How do Canadians’ ability to sustain higher levels of debt compare to other markets?
- How do Canadians borrow in the face of tighter Schedule A bank restrictions?
- How can I learn more about private real estate investing?
Our community of investors asks us all the time: Are Canadian house prices too high? Is Canadian real estate pricing too expensive? These questions don’t have simple yes or no answers, so we put together a report on assessing affordability based on a number of factors to hopefully provide additional insight. Here, we outline indicative data that might point to some of the reasons why major urban centres in Canada still show a positive price trend, based on how certain factors compare to other markets.
How do Canada’s price to income ratios compare to other markets?
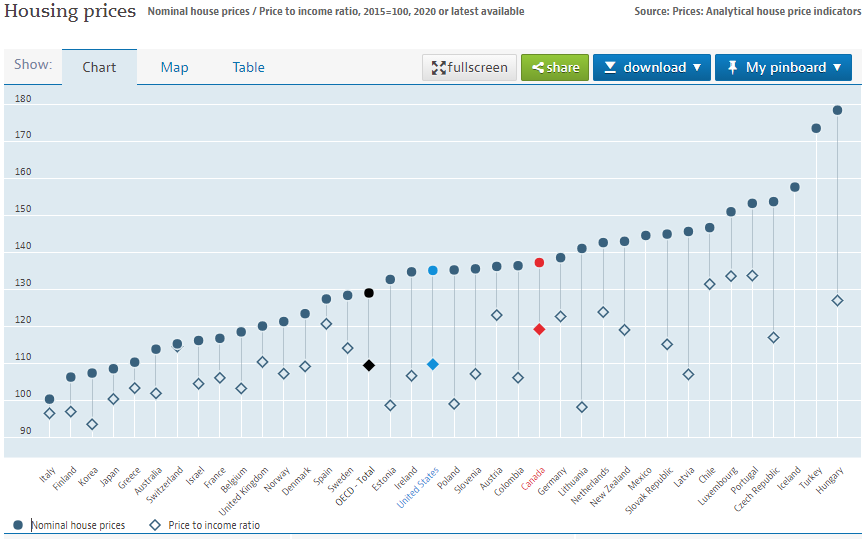
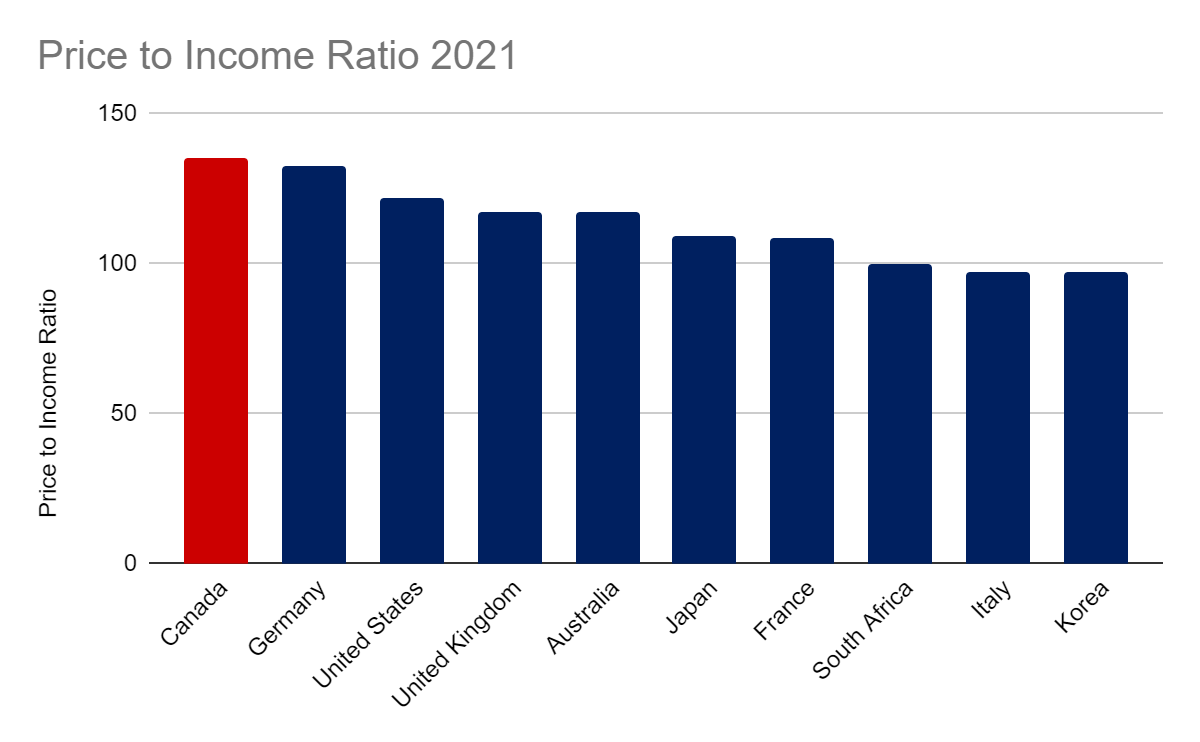
A good place to start when assessing affordability is the price-to-income ratio. The price to income ratio is the ratio between the price of a home and the annual household income in a particular area. Based on OECD data, when compared internationally, Canada may not appear to be an expensive real estate market. However, when compared to the G7 countries, Canada is currently the highest — in both price to income ratios and nominal housing prices.
How does Canada’s population growth compare to other markets?
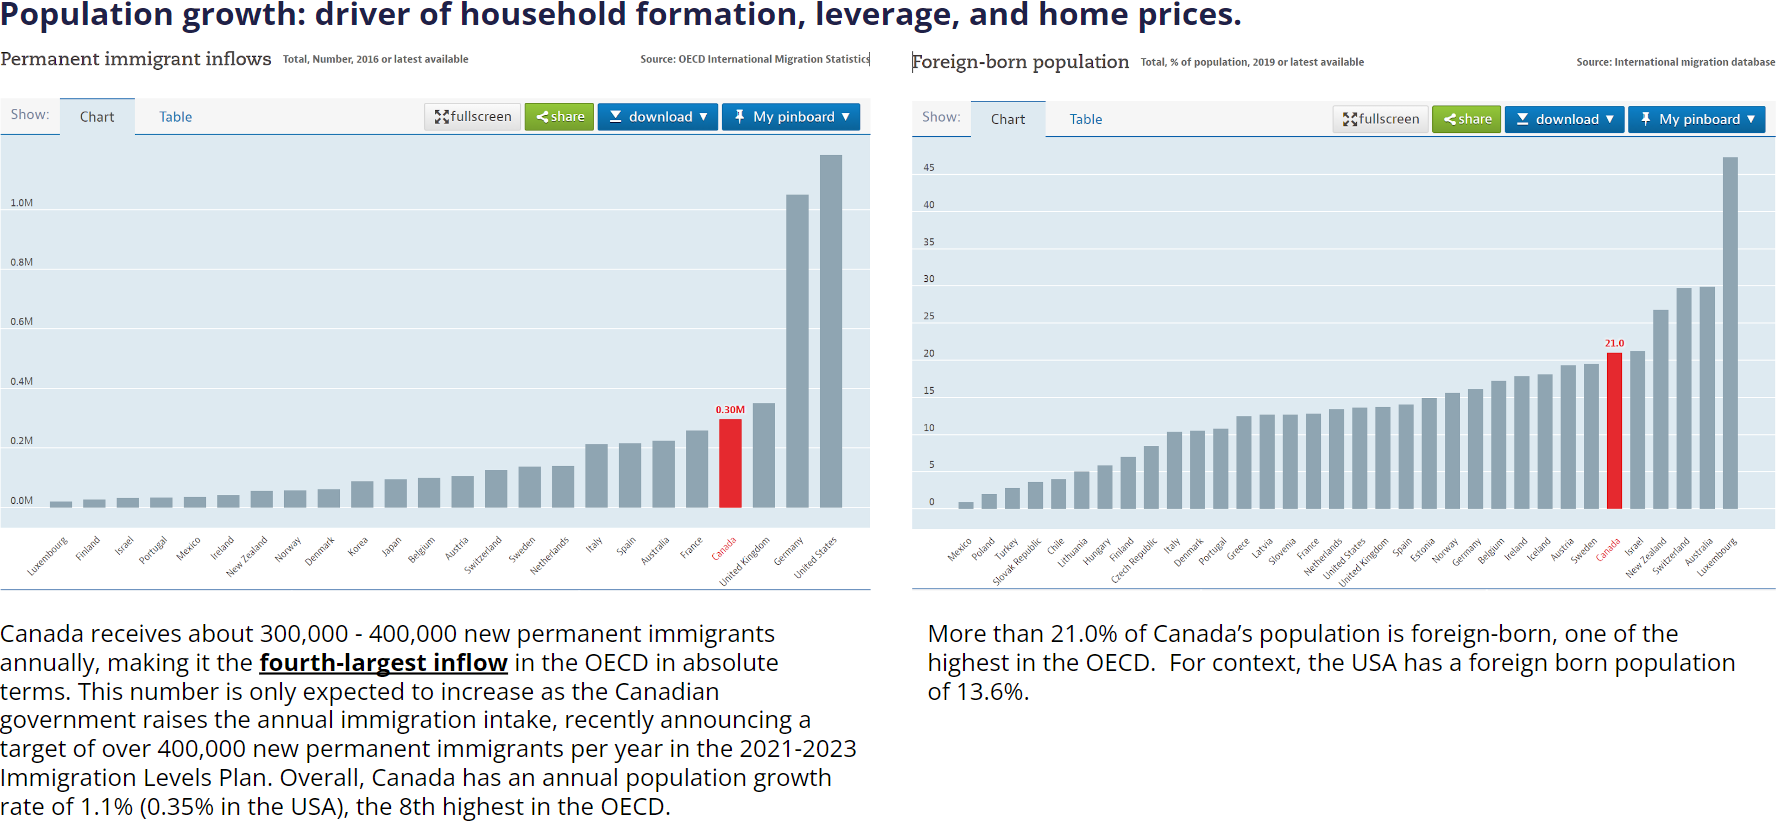
Canada receives about 300,000 – 400,000 new permanent immigrants annually, making it the fourth-largest inflow in the OECD in absolute terms. This number is only expected to increase as the Canadian government raises the annual immigration intake, recently announcing a target of over 400,000 new permanent immigrants per year in the 2021-2023 Immigration Levels Plan. Overall, Canada has an annual population growth rate of 1.1% (0.35% in the USA), the 8th highest in the OECD.
More than 21.0% of Canada’s population is foreign-born — one of the highest in the OECD. For context, the USA has a foreign-born population of 13.6%.
How does employment quality among Canada’s foreign-born population compare to other markets?
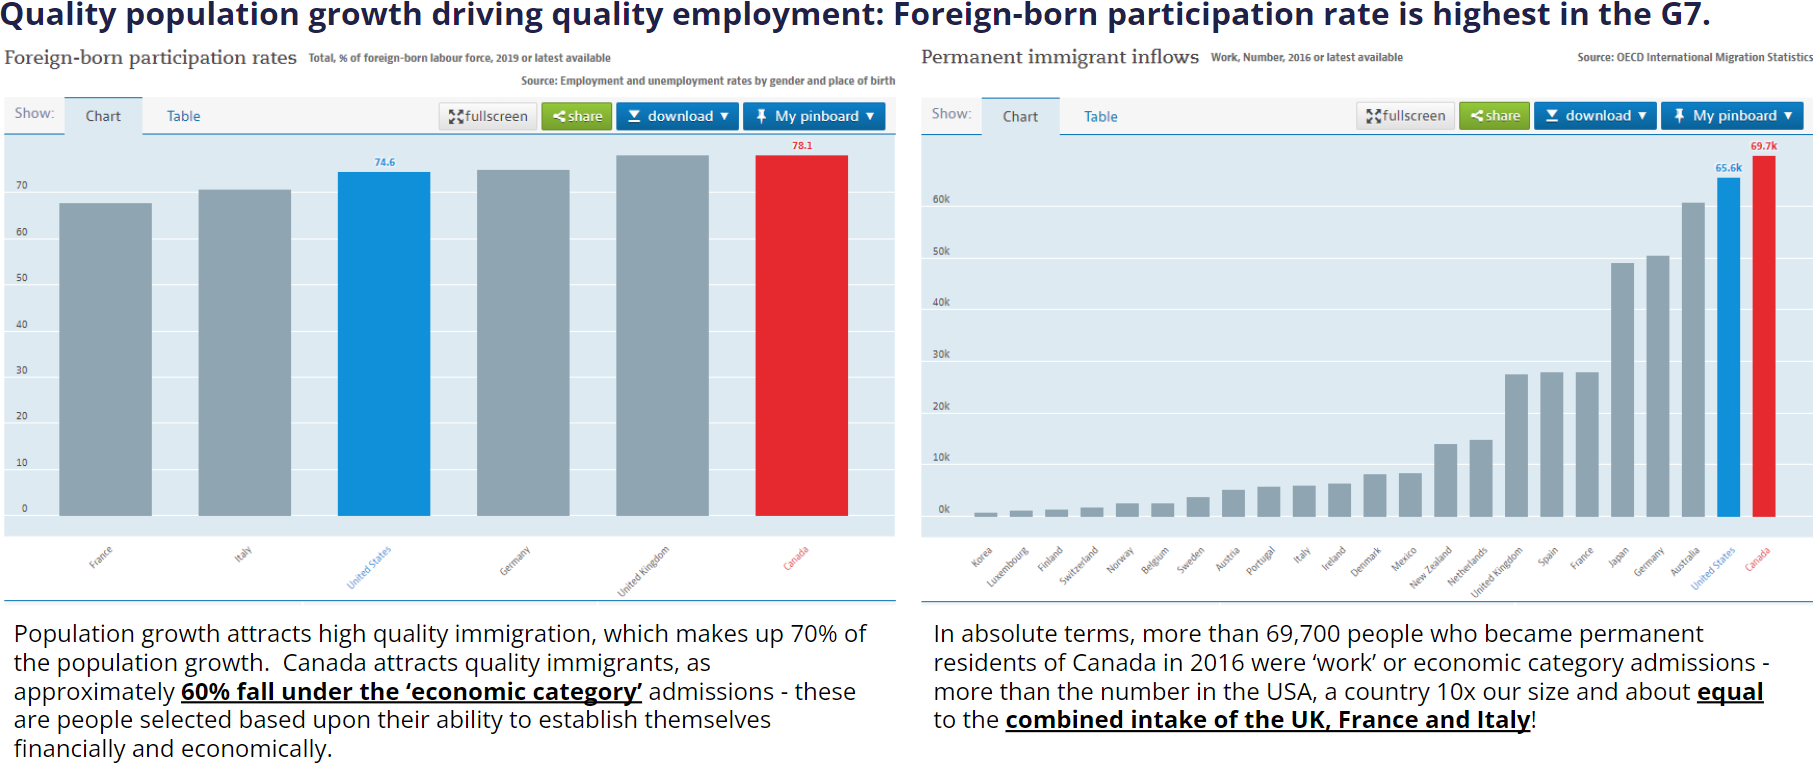
Population growth attracts high-quality immigration, which makes up 70% of Canada’s population growth. Canada attracts quality immigrants, with approximately 60% falling under the ‘economic category’ admissions — these are people selected based upon their ability to establish themselves financially and economically.
In absolute terms, more than 69,700 people who became permanent residents of Canada in 2016 were ‘work’ or ‘economic category’ admissions.
This increases the demand for housing from a productive segment of the population.
How does Canada’s household disposable income compare to other markets?
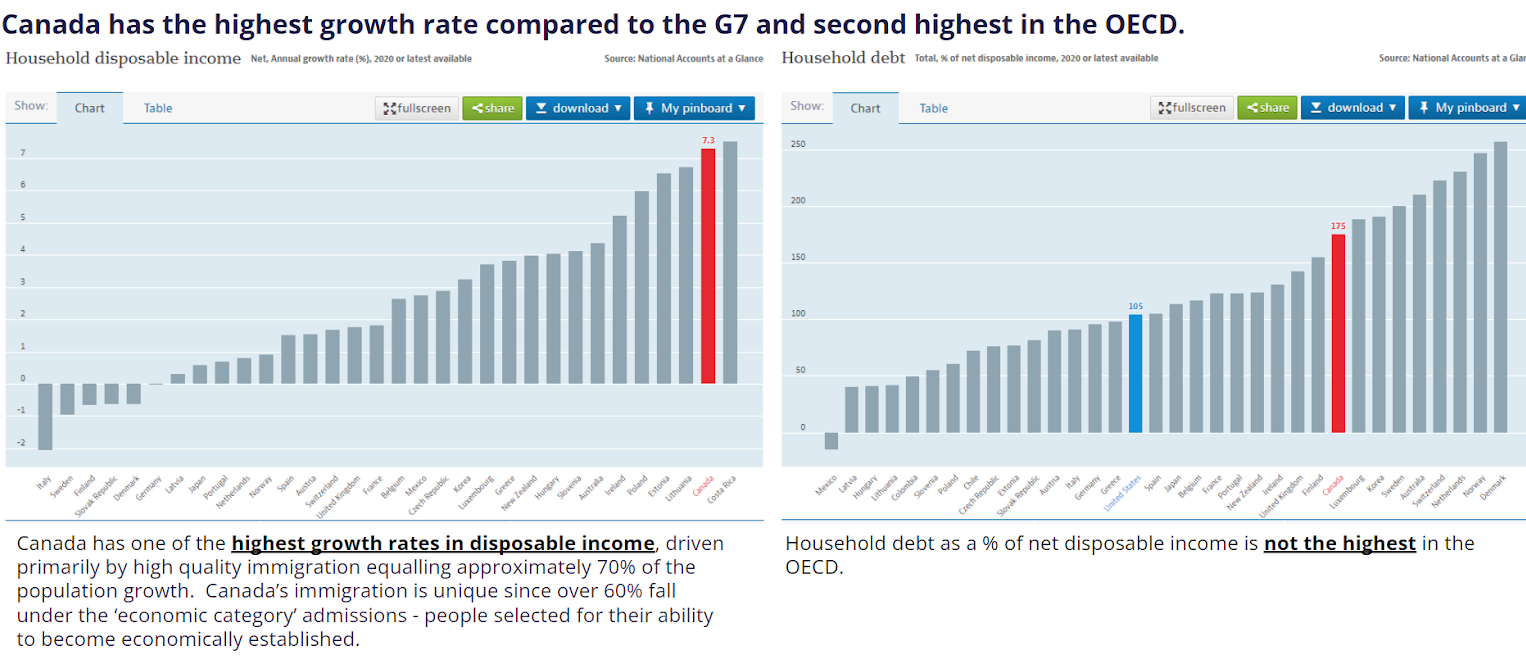
Canada has one of the highest growth rates in disposable income, driven primarily by high quality immigration equalling approximately 70% of the population growth. Canada’s immigration is unique since over 60% fall under the ‘economic category’ admissions – people selected for their ability to become economically established. However, it is also important to assess household debt as a percentage of net disposable income, and Canada does not have the highest in the OECD.
How do Canadians’ ability to sustain higher levels of debt compare to other markets?
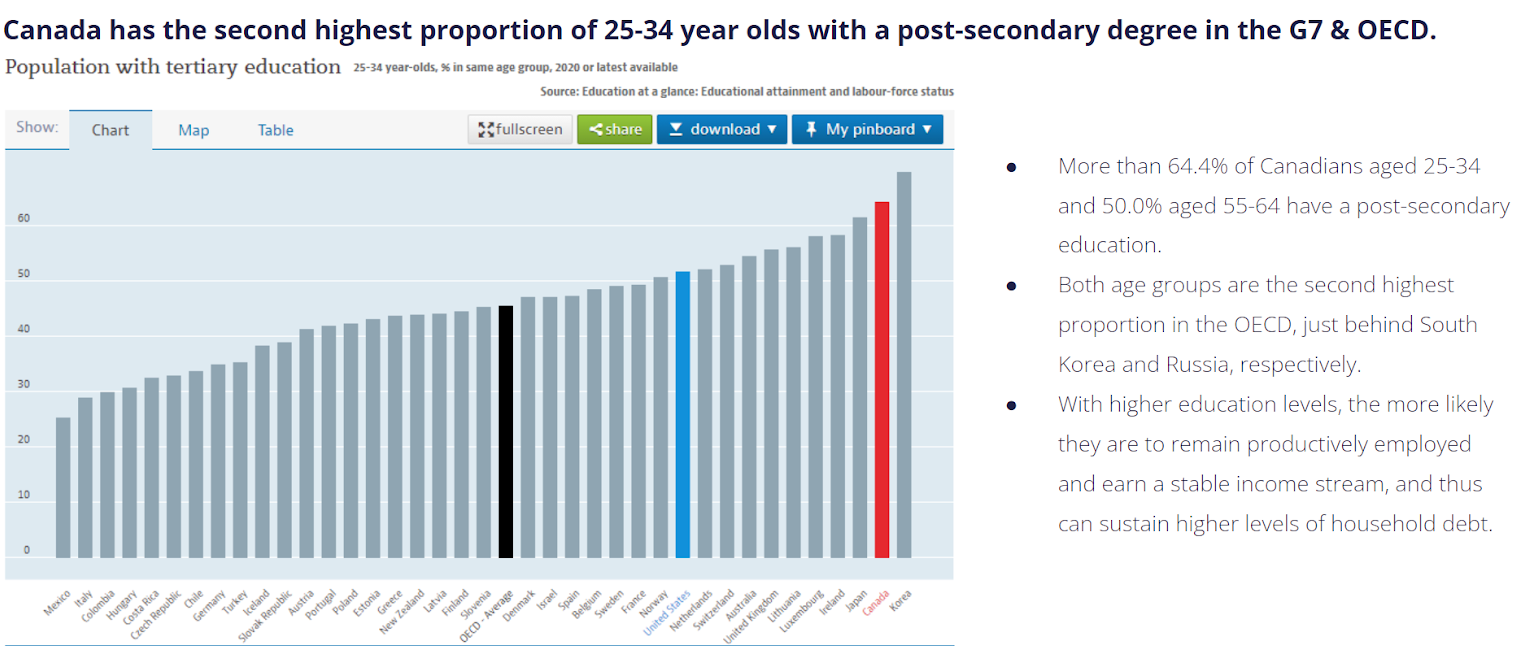
Generally speaking, the higher one’s education level, the more likely they are to remain productively employed and earn a stable income stream. Thus, the more likely they are to be able to sustain higher levels of household debt or have higher levels of savings. More than 64.4% of Canadians aged 25-34 and 50.0% aged 55-64 have a post-secondary education. Both age groups are the second-highest proportion in the OECD, just behind South Korea and Russia, respectively.
How do Canadians borrow in the face of tighter Schedule bank A restrictions?
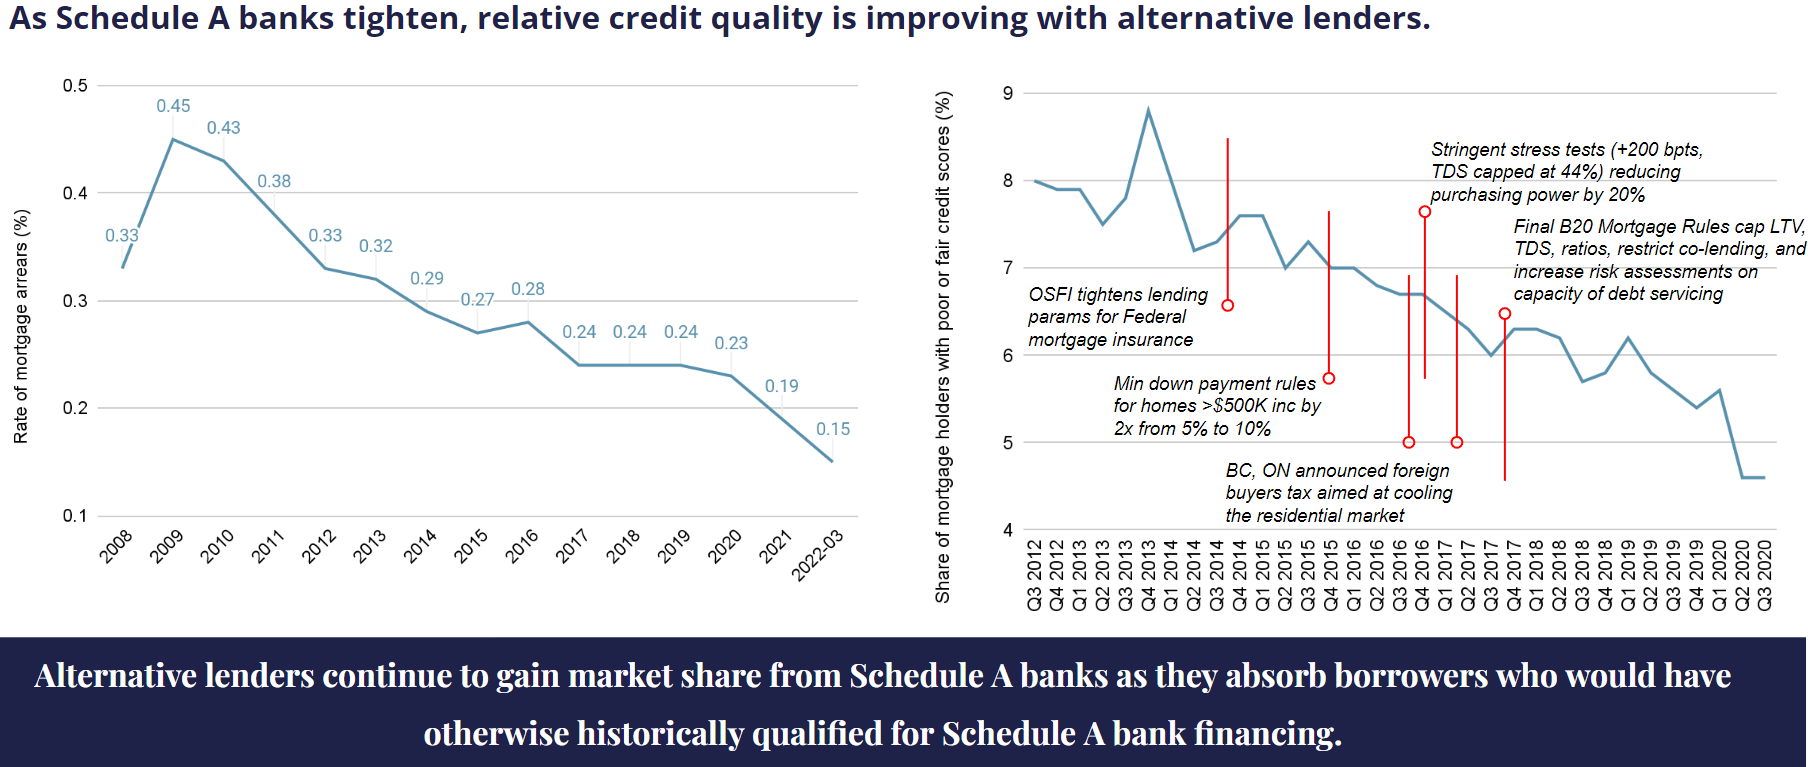
Financial policies determined by OSFI have been very proactive at managing household indebtedness, including higher down payment requirements, stringent stress tests for borrowers, and higher ratio tests to pre-qualify borrowers for mortgages. As Schedule A banks tighten restrictions, this creates opportunities for private lenders to offer financing solutions to a segment of borrowers that seems to be increasing in borrower quality given tighter and tighter restrictions. The above chart shows the impact of credit tightening and borrower loan quality.
References
- CDN household debt excluding mortgage debt: https://www150.statcan.gc.ca/n1/pub/11-621-m/11-621-m2021004-eng.htm
- 17 stats on CDN household debt: https://reviewlution.ca/resources/canadian-household-debt-statistics/
- CDN household debt chart statscan: https://www150.statcan.gc.ca/t1/tbl1/en/cv.action?pid=3610063901
- OECD population data: https://data.oecd.org/pop/population.htm
- OECD foreign born migration data: https://data.oecd.org/migration/foreign-born-population.htm
- OECD tertiary education attainment: https://data.oecd.org/eduatt/population-with-tertiary-education.htm
- OECD house prices: https://data.oecd.org/price/housing-prices.htm
- Canadian Bankers Association – https://cba.ca/mortgages-in-arrears


